
Research
How to Find Hidden Supply-Chain Concentration in a Stock Portfolio
An investor-focused framework and semiconductor case study for finding shared suppliers, customers, internal edges, and hidden portfolio dependencies.
- Author
- Altsets Research
- Published / updated
- July 20, 2026 / July 20, 2026
- Data as of
- July 20, 2026
Key findings
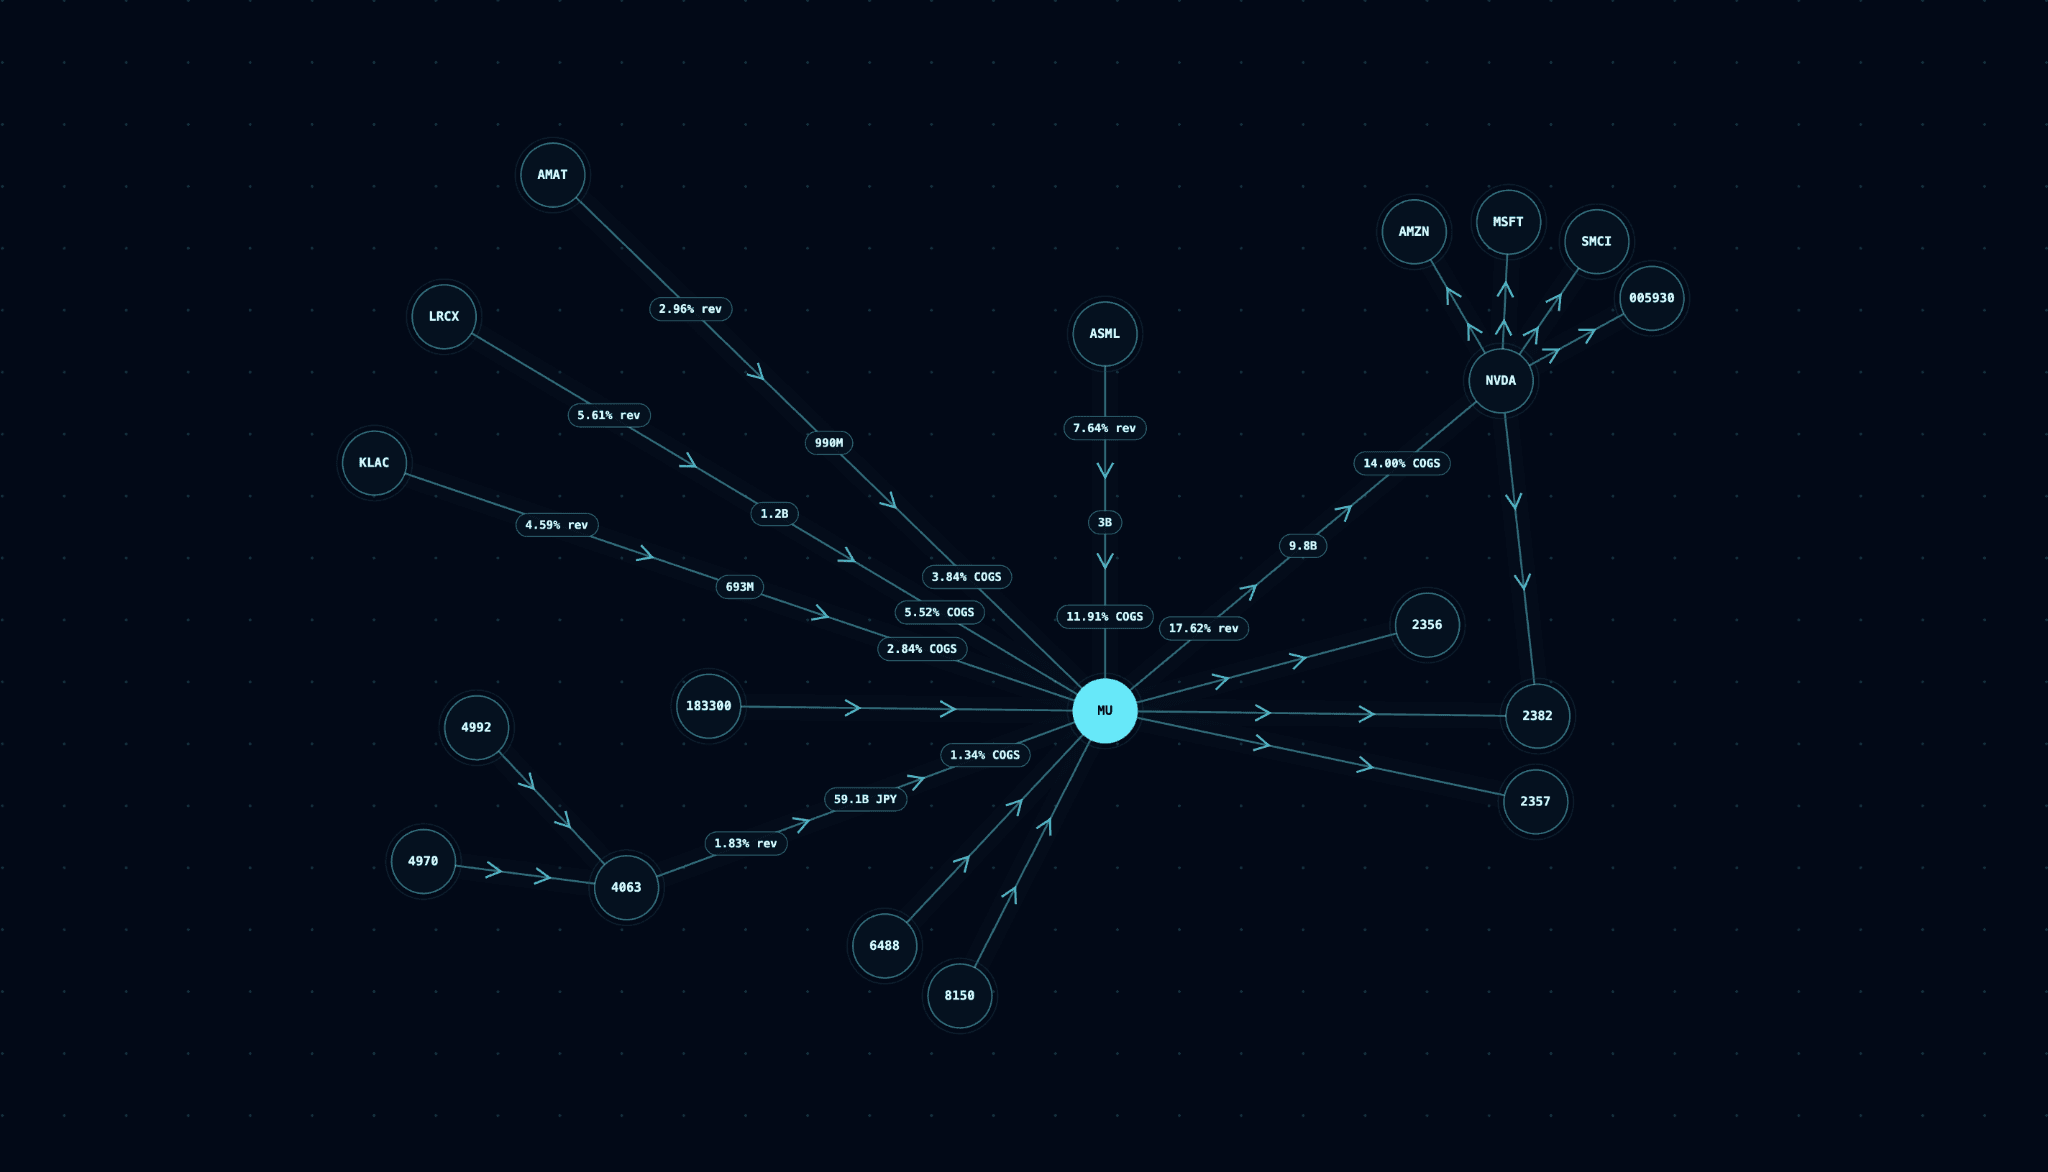
- The displayed semiconductor network contains a direct ASML-to-Micron-to-NVIDIA commercial chain.
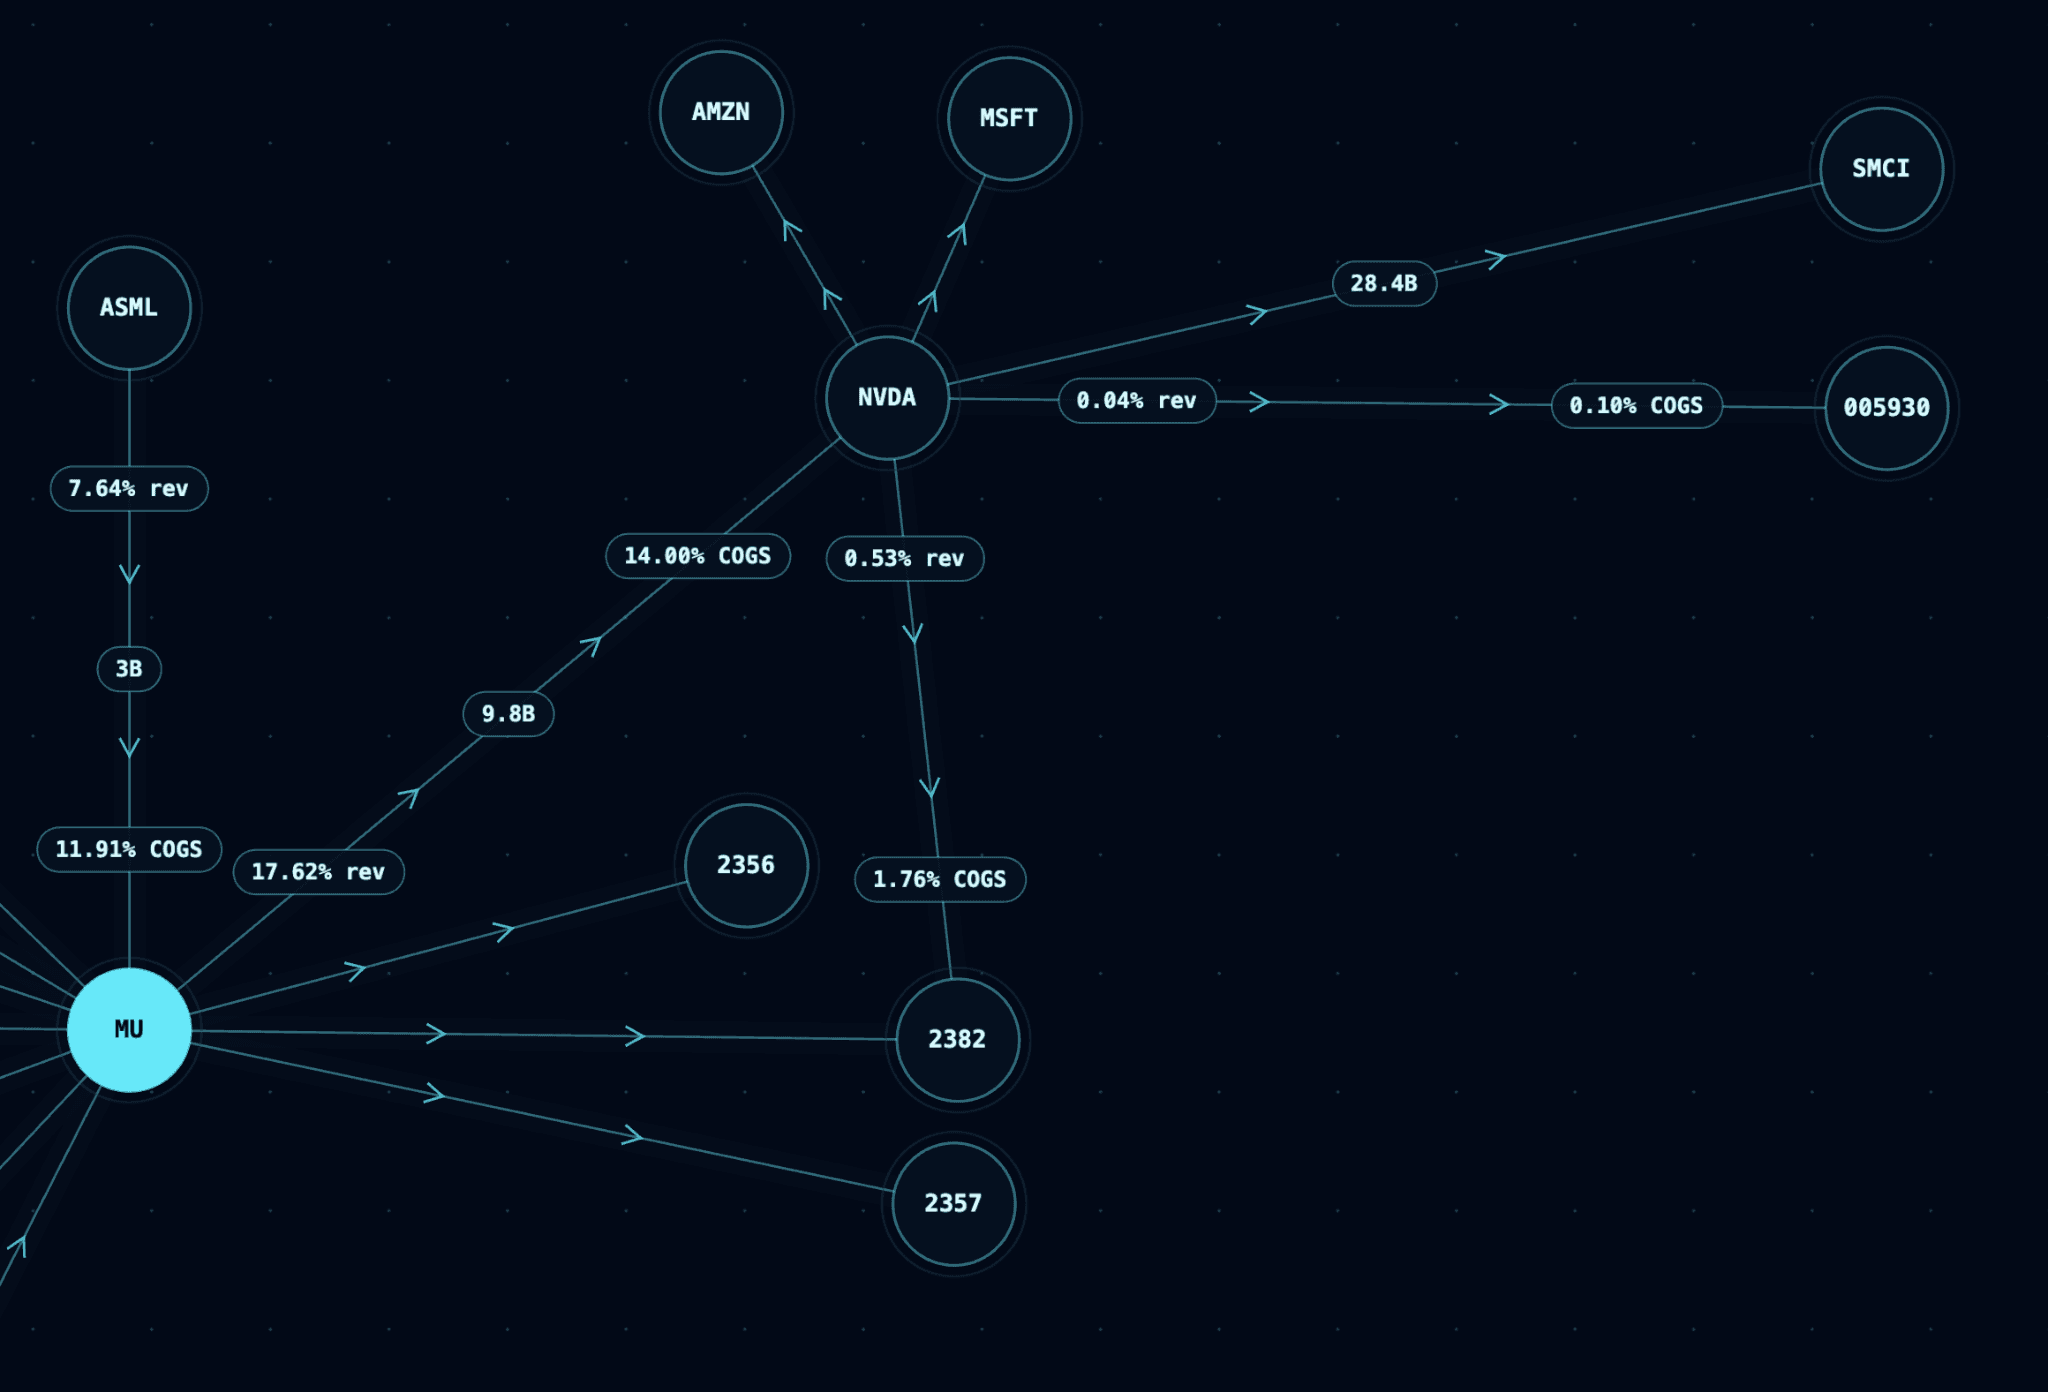
- The Micron-to-NVIDIA edge is estimated at 17.62% of Micron revenue, 9.8B in relationship size, and 14.00% of NVIDIA COGS.
- Micron is shown buying from ASML, Lam Research, KLA, Applied Materials, and Shin-Etsu Chemical, with materially different supplier- and customer-side percentages.
- Micron and NVIDIA both connect downstream to Quanta Computer, illustrating a shared counterparty that ticker-level allocation would not reveal.
A portfolio can hold different tickers and industries while still depending on the same suppliers, customers, manufacturers, and operational bottlenecks. Supply-chain concentration analysis looks beneath sector labels to find those shared economic dependencies.
This case study uses a fixed, illustrative three-company holding set—ASML (ASML), Micron Technology (MU), and NVIDIA (NVDA)—and the relationships visible in the supplied Altsets maps as of July 20, 2026. The companies were selected because the map contains a connected commercial chain among all three, not because they represent a named fund or model portfolio.
The result is a bounded example of what ticker-level diversification can miss: two direct holding-to-holding relationships, several suppliers converging on Micron, and one external customer shared by Micron and NVIDIA.
Key result at a glance
Within the visible first-degree network, the three-company case study contains:
- 17 directed relationships touching ASML, Micron, or NVIDIA;
- 2 internal portfolio relationships: ASML → Micron and Micron → NVIDIA;
- 15 external counterparty connections involving 14 unique external entities; and
- 1 shared external counterparty: Quanta Computer (2382), connected downstream to both Micron and NVIDIA.
The counts include ticker-only nodes as distinct entities but do not assign names or locations where the map does not provide enough information. The two upstream nodes feeding Shin-Etsu Chemical are second-degree relationships and are excluded from the 17 first-degree relationships.
What is portfolio supply-chain concentration?
Portfolio supply-chain concentration is the degree to which multiple holdings connect to the same external companies or operational dependencies.
Traditional concentration analysis focuses on position weights, sectors, industries, countries, or investment factors. Those views remain useful, but they do not reveal whether different holdings depend on the same foundry, equipment maker, component supplier, contract manufacturer, distributor, or large customer.
A portfolio can therefore appear diversified at the ticker level while remaining concentrated in the network beneath the holdings. A chip designer, a cloud-infrastructure company, and a networking-equipment company may have different revenue models but still rely on the same semiconductor manufacturing or packaging ecosystem.
Supply-chain concentration does not replace sector or factor analysis. It adds a relationship layer that conventional allocation charts do not capture.
Scope and selection rule
The analyzed holding set is exactly ASML, Micron, and NVIDIA. The analysis includes every first-degree supplier or customer edge touching one of those three companies in the supplied overview map.
The method applies four constraints:
- Supplier-to-customer direction is preserved.
- Direct relationships between the three holdings are counted separately from external counterparties.
- A counterparty is considered shared only when the same visible entity connects to at least two holdings.
- Missing percentages and relationship sizes remain unknown; they are never converted to zero.
This is an illustrative case study rather than a census of a real investor's account. No external fund definition is required because the holding set is defined directly by the analysis.
Finding 1: the holdings form a direct commercial chain
The strongest structural finding is the chain ASML → Micron → NVIDIA.
ASML is shown supplying Micron. The edge displays estimates of 7.64% of ASML revenue, a 3B relationship size, and 11.91% of Micron cost of goods sold.
Micron is then shown supplying NVIDIA. That edge displays estimates of 17.62% of Micron revenue, a 9.8B relationship size, and 14.00% of NVIDIA cost of goods sold.
These are internal portfolio edges: the illustrative holding set owns the supplier and customer on both sides of each relationship. That creates direct economic linkage inside the portfolio even before any shared external company is considered.
Finding 2: several equipment and materials suppliers converge on Micron
The overview contains eight visible first-degree suppliers feeding Micron. Five are identified in the map or accompanying labels as ASML, Applied Materials, Lam Research, KLA, and Shin-Etsu Chemical. Three additional first-degree suppliers appear as ticker-only nodes.
The named supplier relationships carry materially different estimates:
| Relationship | Supplier revenue | Relationship size | Customer COGS |
|---|---|---|---|
| ASML → Micron | 7.64% | 3B | 11.91% |
| Lam Research → Micron | 5.61% | 1.2B | 5.52% |
| KLA → Micron | 4.59% | 693M | 2.84% |
| Applied Materials → Micron | 2.96% | 990M | 3.84% |
| Shin-Etsu Chemical → Micron | 1.83% | 59.1B JPY | 1.34% |
The table demonstrates why a supplier count is only a starting point. Each relationship can look different from the supplier's revenue perspective, the customer's cost perspective, and its estimated monetary size. The figure explicitly labels the Shin-Etsu relationship in JPY; the other size labels are reproduced exactly as displayed rather than assigned an assumed currency.
Finding 3: Quanta Computer is the visible shared external counterparty
Micron and NVIDIA both connect downstream to Quanta Computer (2382). Within this bounded network, Quanta is the only external entity visibly connected to more than one holding.
The NVIDIA-to-Quanta edge shows estimates of 0.53% of NVIDIA revenue and 1.76% of Quanta's cost of goods sold. The Micron-to-Quanta edge is visible, but the supplied view does not show comparable metrics for it.
Because only one external counterparty qualifies as shared, the shared-counterparty result is a single observation rather than a ranking. The correct conclusion is narrow: the map shows downstream customer overlap between Micron and NVIDIA at Quanta. It does not establish that Quanta is the largest shared dependency in a broader portfolio.
NVIDIA's visible downstream network also includes Amazon, Microsoft, Super Micro Computer, Samsung Electronics, and Quanta. The NVIDIA-to-Super Micro Computer edge shows a 28.4B relationship size. The NVIDIA-to-Samsung edge shows 0.04% of NVIDIA revenue and 0.10% of Samsung's cost of goods sold.
Why ticker and sector diversification miss these links
Ticker diversification counts securities. Sector diversification groups companies by a classification system. Neither reconstructs the commercial relationships connecting the companies.
ASML, Micron, and NVIDIA occupy different positions in the semiconductor value chain, yet the map links them directly. An allocation view may treat them as three positions with distinct business models. The relationship view shows that one holding supplies another, which in turn supplies the third.
The Quanta overlap adds a second form of concentration. Micron and NVIDIA do not merely participate in the same broad industry; they are both shown selling into the same downstream company. That common customer would be invisible in a standard sector-weight chart.
How to read the relationship metrics
Each metric describes a different side of an estimated relationship:
- Supplier revenue percentage estimates how much of the supplier's revenue is associated with the customer relationship.
- Customer cost percentage estimates how much of the customer's costs is associated with the supplier relationship.
- Relationship size estimates the monetary scale of the relationship.
These measures should remain separate. A large relationship can still be a small share of a very large company's economics, while a smaller relationship can represent a meaningful share of a smaller supplier's revenue.
The map also contains edges without displayed metrics. Their presence supports a relationship observation, but not a claim about economic weight. Missing values remain unknown.
Does a shared supplier or customer automatically create material risk?
No. Network overlap is a signal for further research, not an automatic risk conclusion.
A counterparty can connect to several holdings while remaining economically small or replaceable. Another counterparty may connect to fewer holdings but provide specialized capacity with limited substitutes. A useful interpretation separates three dimensions:
- Breadth: how many holdings connect to the counterparty;
- Weight: how large or economically important the relationships appear; and
- Criticality: how difficult the supplied product, capacity, or customer demand may be to replace.
Altsets helps investigate breadth and estimated weight. Criticality often requires company-specific research into contracts, qualification processes, capacity constraints, inventory, and substitute availability.
What this case study can and cannot establish
The maps establish that the selected network contains a direct ASML-to-Micron-to-NVIDIA chain, several upstream relationships converging on Micron, and a visible customer overlap at Quanta. The displayed metrics also show that the same edge can carry different significance for the supplier and customer.
The analysis does not prove contractual exclusivity, exact purchasing volumes, replacement lead times, operational locations, or the direction of a future stock-price reaction. It also does not claim complete coverage of every supplier or customer connected to the three holdings.
Every relationship, value, and percentage displayed by Altsets is an estimated research output. The appropriate use is to identify where a portfolio merits deeper investigation, not to turn a network connection into a buy or sell signal.
A repeatable workflow for other portfolios
The same method can be applied to a larger holding set:
- Fix the holdings universe and analysis date before examining results.
- Map first-degree suppliers and customers separately.
- Normalize aliases, subsidiaries, and duplicate entity names.
- Count counterparties connected to multiple holdings.
- Separate external dependencies from holding-to-holding relationships.
- Add supplier revenue percentage, customer cost percentage, and relationship size where available.
- Preserve missing metrics as unknown.
- Investigate the most consequential overlaps using company filings and other primary context.
The output is not a universal concentration score. It is a prioritized map of shared dependencies that complements position, sector, and factor analysis.
Conclusion
This three-company example reveals two kinds of hidden concentration. First, ASML, Micron, and NVIDIA are linked by two direct commercial relationships inside the holding set. Second, Micron and NVIDIA share Quanta Computer as a visible downstream counterparty.
The upstream Micron relationships reinforce the central lesson: raw connection counts are not enough. Supplier revenue share, customer cost share, and estimated relationship size describe different economic perspectives and can lead to different research priorities.
Portfolio diversification is therefore not only a question of how many securities an investor owns. It is also a question of how those companies connect beneath their ticker and sector labels.