
SK Hynix, Nvidia, and Apple: Which Relationship Is More Economically Important?
August 23, 2026
Altsets
Research by Altsets Research
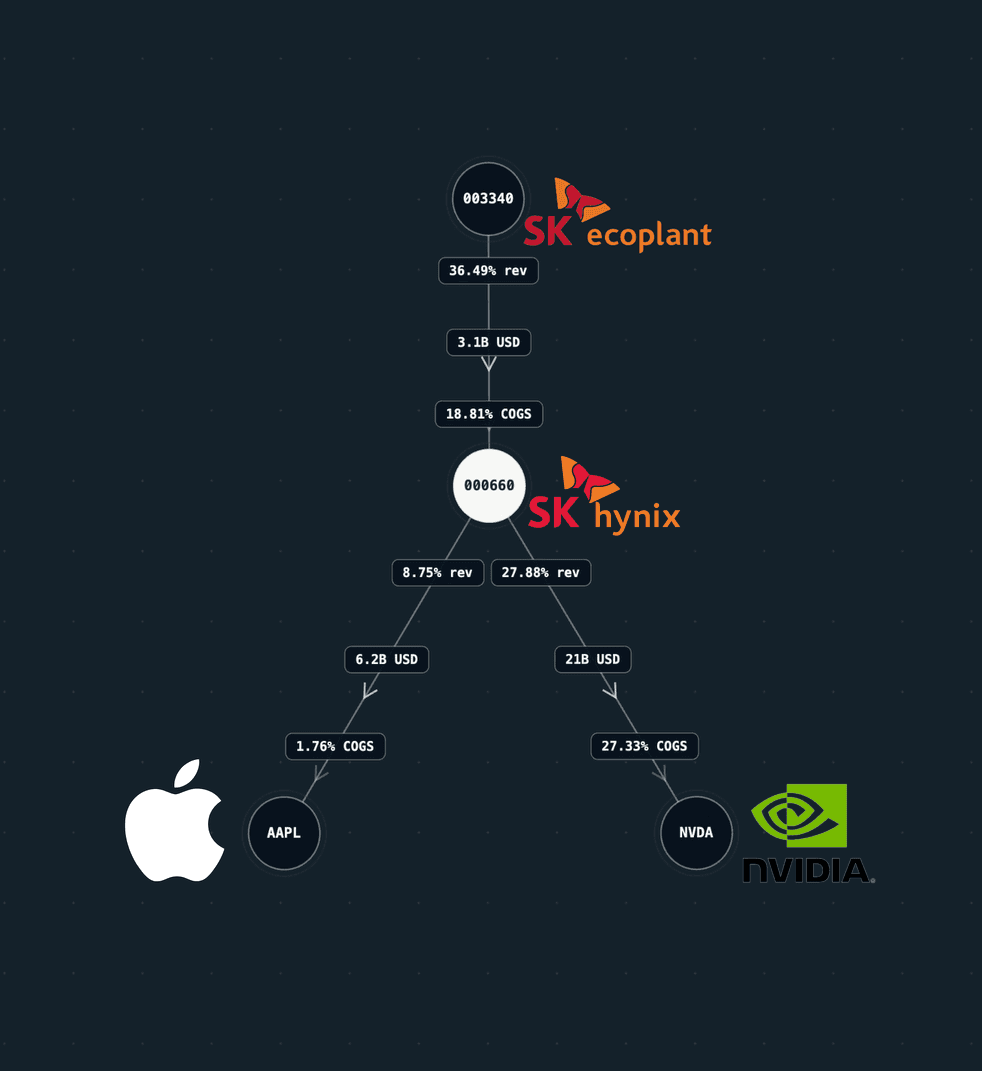
Altsets estimates SK Hynix's Nvidia relationship at 27.88% of supplier revenue, 21B USD, and 27.33% of Nvidia COGS, versus 8.75%, 6.2B USD, and 1.76% for Apple.
Data used:Altsets Supply Chain Intelligence: 90k+ entities, 400k+ relationships, 20+ years of history.
Key findings
- The SK Hynix to Nvidia relationship is estimated at 27.88% of SK Hynix revenue, 21B USD in relationship size, and 27.33% of Nvidia COGS.
- The SK Hynix to Apple relationship is estimated at 8.75% of SK Hynix revenue, 6.2B USD in relationship size, and 1.76% of Apple COGS.
- The Nvidia relationship is about 3.39 times larger by relationship size, 3.19 times larger by SK Hynix revenue share, and 15.53 times larger by customer cost percentage.
- The widest difference is on the customer side, making the comparison useful for ranking which customer deserves more attention in a hypothetical SK Hynix supply event.
The Altsets data gives a direct answer: SK Hynix's relationship with Nvidia is economically larger than its relationship with Apple on every displayed measure.
As of July 30, 2026, Altsets estimates the SK Hynix to Nvidia relationship at 27.88% of SK Hynix revenue, 21B USD in relationship size, and 27.33% of Nvidia cost of goods sold. The SK Hynix to Apple relationship is estimated at 8.75% of SK Hynix revenue, 6.2B USD, and 1.76% of Apple cost of goods sold.
This is more than a supplier-list comparison. Because the supplier is held constant, the two relationships show how differently the same supplier can matter across two major customers.
Nvidia versus Apple in the Altsets data
Measure | SK Hynix to Nvidia | SK Hynix to Apple | Nvidia multiple |
|---|---|---|---|
Supplier revenue percentage | 27.88% | 8.75% | 3.19x |
Relationship size | 21B USD | 6.2B USD | 3.39x |
Customer cost percentage | 27.33% | 1.76% | 15.53x |
The Nvidia relationship is approximately 3.39 times larger in absolute relationship size, 3.19 times larger as a share of SK Hynix revenue, and 15.53 times larger as a share of customer costs.
The last comparison is the most striking. The gap on the customer side is much wider than the gap in absolute relationship size.
Why the customer-side gap matters
A 21B USD relationship is already much larger than a 6.2B USD relationship. The customer cost percentages reveal an additional difference that the dollar values alone do not show.
The Nvidia relationship represents an estimated 27.33% of Nvidia COGS. The Apple relationship represents an estimated 1.76% of Apple COGS.
That does not mean 27.33% of Nvidia's products depend on one irreplaceable SK Hynix input. Customer cost percentage measures economic share, not operational substitutability. It does show that the mapped SK Hynix relationship occupies a much larger portion of Nvidia's cost base than it does Apple's.
For event research, this changes the order of investigation. If a hypothetical SK Hynix supply event affected both mapped relationships equally, Nvidia would deserve earlier attention based on the displayed customer cost exposure.
The data does not say what the market reaction would be. It gives the researcher a quantitative reason to investigate one customer before the other.
The supplier side points to the same customer
The comparison also works in the opposite direction.
Nvidia is associated with 27.88% of SK Hynix revenue in the displayed estimate, while Apple is associated with 8.75%. Holding SK Hynix constant makes this a direct customer-importance comparison from the supplier's perspective. That makes Nvidia a more important read-through candidate when the research starts with customer demand rather than supplier disruption.
If Nvidia reports a major change in AI infrastructure demand, memory purchasing, or system production, the 27.88% supplier revenue estimate gives a reason to examine SK Hynix. If Apple reports a comparable change, the 8.75% estimate still matters, but the displayed supplier-side concentration is lower. Again, that is a research-priority statement, not a forecast of revenue or stock performance.
Why Apple can still have a large relationship
The Apple relationship is estimated at 6.2B USD, which is large in absolute terms. Its customer cost percentage is only 1.76% because the percentage is measured against Apple's cost base. This is an important supply-chain research pattern: large dollar relationships do not necessarily create large relative exposure for both companies.
A conventional list of named suppliers can tell a researcher that Apple and Nvidia both connect to SK Hynix. The Altsets metrics separate those two connections economically.
That difference matters when a portfolio contains both customers. Treating the shared supplier as an equal exposure would discard information contained in the relationship values.
What the comparison can be used for
One use is shared-supplier shock ranking. When multiple companies connect to the same supplier, customer cost percentage can help prioritize which customers have the largest mapped cost exposure.
A second use is supplier customer-concentration analysis. Supplier revenue percentage can rank which customers appear most important to the supplier's revenue base.
A third use is portfolio look-through. If Nvidia and Apple are both holdings, the common SK Hynix connection reveals shared upstream exposure that sector or ticker labels do not describe. The relationship metrics then show that the exposure is not evenly distributed. For a broader example of that portfolio method, see How to Find Hidden Supply-Chain Concentration in a Stock Portfolio.
These use cases all begin with the same relationship graph, but they ask different questions of it. The analysis here is limited to comparing the displayed SK Hynix relationships with Nvidia and Apple.
What public context adds
SK Hynix publicly describes its memory business and has discussed a multi-year technology partnership with Nvidia. Apple has publicly identified SK Hynix among its manufacturing suppliers.
Those sources help establish business context around the mapped relationships. They do not provide the three Altsets relationship estimates used in this comparison.
This separation is important for reproducibility. Public company sources provide product and partnership context. The quantified relationship comparison comes from the Altsets data shown for the stated date.
What the comparison does not prove
The data does not establish:
- exact memory volumes purchased by either customer;
- product exclusivity;
- inventory levels;
- substitute supplier capacity;
- contract duration or pricing;
- qualification and switching time;
- production-site exposure;
- the financial effect of a future supply interruption.
It also does not claim that the two relationships cover every SK Hynix product sold to Nvidia or Apple. The percentages use different denominators across companies, so the comparison should be read as economic exposure within the Altsets model rather than as a universal dependency score. For metric definitions, relationship direction, missing-data treatment, and point-in-time methodology, read the Altsets supply-chain data methodology.
Why this is a different question from Tesla and LG Energy Solution
The LG Energy Solution and Tesla analysis asks which side of one relationship is more concentrated. This article holds the supplier constant and asks which of two customer relationships is economically more important.
That difference is the point of the research library. The same underlying relationship metrics can answer different investment and risk questions without turning every company page into another supplier list. Browse the Company Dependency Research collection for other company-specific analyses.