
LG Energy Solution and Tesla: Which Side Has More Relationship Concentration?
July 30, 2026
Altsets
Research by Altsets Research
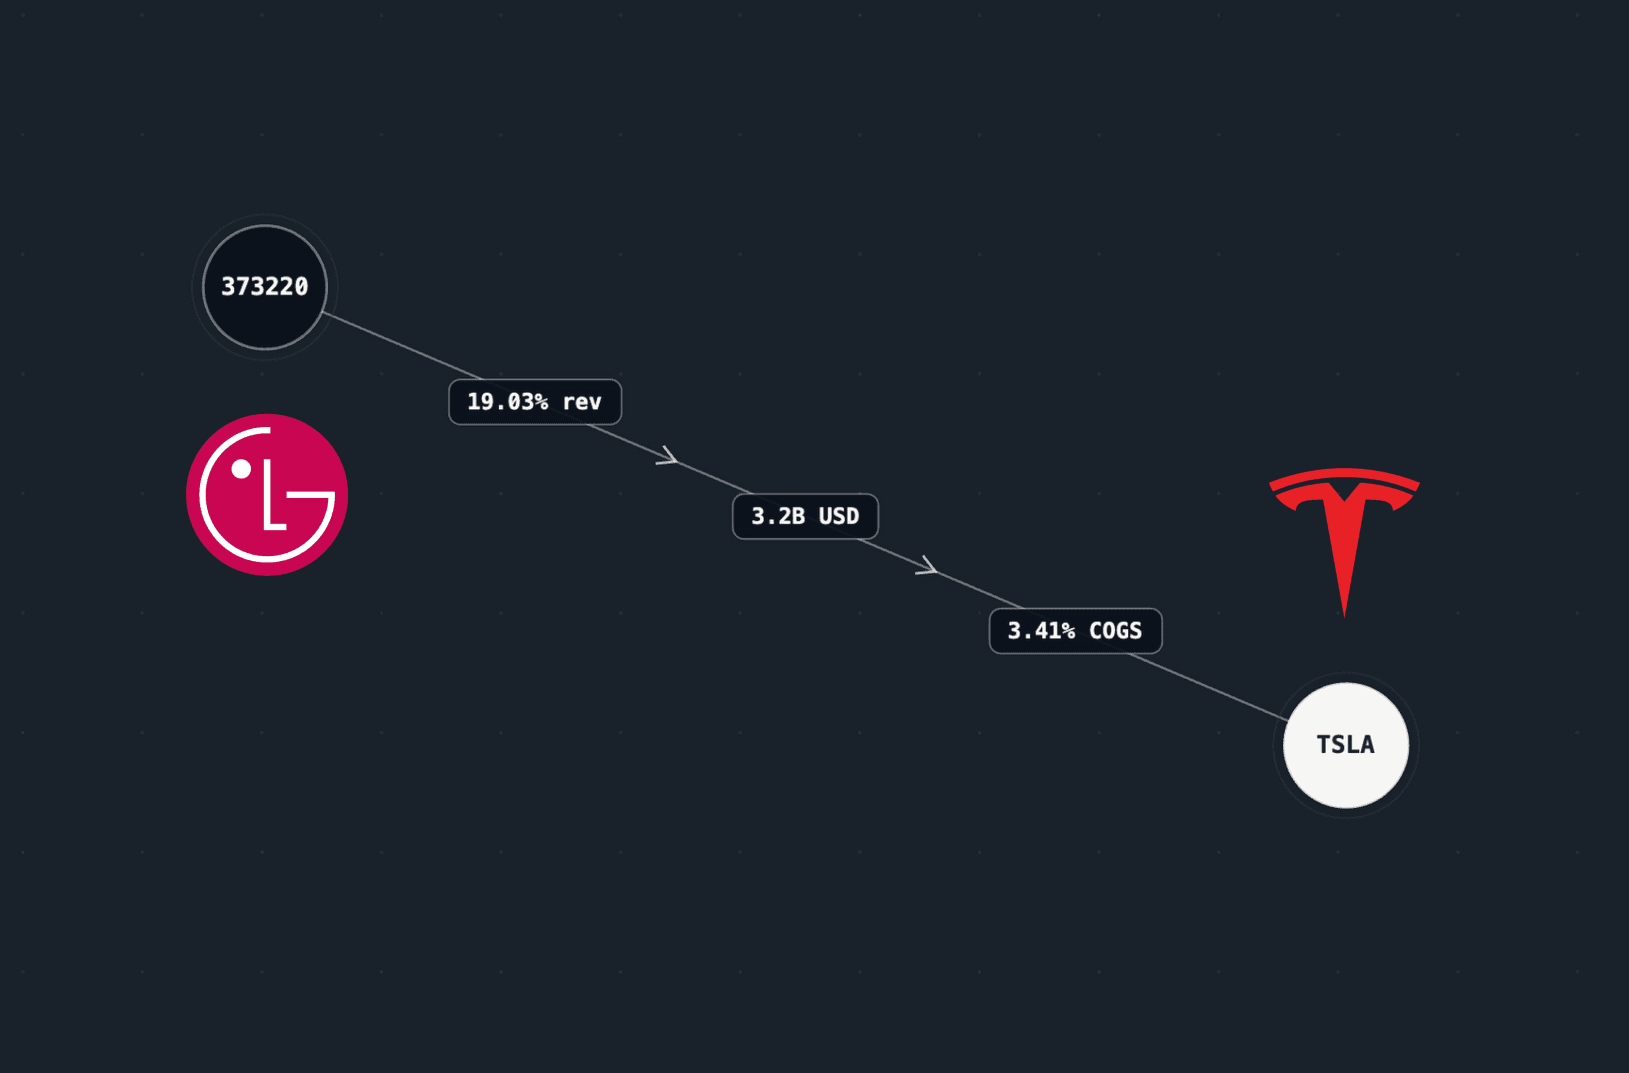
Altsets estimates the LG Energy Solution to Tesla relationship at 19.03% of supplier revenue, 3.2B USD, and 3.41% of Tesla COGS, showing heavier supplier-side concentration.
Data used:Altsets Supply Chain Intelligence: 90k+ entities, 400k+ relationships, 20+ years of history.
Key findings
- The LG Energy Solution to Tesla relationship is estimated at 19.03% of LG Energy Solution revenue, 3.2B USD in relationship size, and 3.41% of Tesla COGS.
- The supplier revenue estimate is about 5.58 times the customer cost estimate numerically, but the percentages use different denominators and should not be treated as a formal dependency ratio.
- The displayed data supports the conclusion that Tesla is more concentrated within LG Energy Solution's revenue base than LG Energy Solution is within Tesla's cost base.
- The relationship is useful for customer read-through and supplier concentration research, but it does not establish replacement difficulty, exclusivity, or the exact battery product involved.
Altsets data gives a clear answer: Tesla is more concentrated within LG Energy Solution's revenue base than LG Energy Solution is within Tesla's cost base in this relationship. As of July 30, 2026, Altsets estimates the LG Energy Solution to Tesla relationship at 19.03% of LG Energy Solution revenue, 3.2B USD in relationship size, and 3.41% of Tesla cost of goods sold.
The useful signal is not simply that LG Energy Solution supplies Tesla. Public information can establish that the companies participate in the electric vehicle battery ecosystem. The differentiating question is how large the relationship appears from each company's economic perspective.
The relationship in one row
| Relationship | Supplier revenue | Relationship size | Customer COGS |
|---|---|---|---|
| LG Energy Solution to Tesla | 19.03% | 3.2B USD | 3.41% |
The three values answer different questions.
19.03% of supplier revenue estimates how much of LG Energy Solution's revenue is associated with Tesla. 3.41% of customer costs estimates how much of Tesla's cost base is associated with LG Energy Solution. 3.2B USD gives the relationship an absolute economic scale. Taken together, the values show a relationship that is material to both sides but much more concentrated within the supplier's revenue base.
Why the two percentages tell different stories
The 19.03% and 3.41% figures should not be compared as if they share the same denominator. They do not.
The supplier revenue percentage is measured against LG Energy Solution's revenue. The customer cost percentage is measured against Tesla's costs. Dividing 19.03 by 3.41 gives about 5.58, but that number is only a numerical comparison between two differently defined percentages. It is not a formal dependency score. The stronger conclusion is simpler: Tesla occupies a much larger share of LG Energy Solution's estimated revenue base than LG Energy Solution occupies of Tesla's estimated cost base.
That distinction matters because a relationship can be economically large without creating equal concentration on both sides. A supplier may depend heavily on a major customer while the customer purchases from many suppliers across a much larger cost base.
What this changes in company research
Suppose an investor is reading a material Tesla demand update and wants to know which suppliers deserve immediate follow-up.
A generic supplier list tells the investor that LG Energy Solution belongs in the research set. The Altsets relationship metrics add a reason to prioritize it. An estimated 19.03% of supplier revenue is large enough to make Tesla-specific demand information economically relevant to research on LG Energy Solution.
The reverse question is different. If LG Energy Solution experiences a supply issue, the estimated 3.41% of Tesla COGS indicates that the relationship is visible within Tesla's cost base. It does not establish that the input is impossible to replace, that inventories are low, or that production would stop. This is why the same relationship supports two different research queues:
- A Tesla demand event can be read through to LG Energy Solution using the supplier revenue estimate.
- An LG Energy Solution supply event can be evaluated from Tesla's side using the customer cost estimate.
The relationship data does not predict either company's stock price. It identifies where an event has a measurable economic connection worth investigating.
Why relationship size alone is not enough
A 3.2B USD relationship sounds important in isolation. The two percentages explain what that size means relative to each company.
For LG Energy Solution, the relationship is estimated at nearly one fifth of revenue. For Tesla, it is estimated at a much smaller share of costs.
That is a useful example of why relationship size should not be treated as a universal importance ranking. The same absolute amount can represent very different levels of concentration for companies of different sizes and business models.
For supplier research, the supplier revenue percentage helps answer whether one customer is unusually important. For customer research, the customer cost percentage helps answer whether one supplier occupies a meaningful share of the cost base. The absolute relationship estimate adds scale, but not direction.
What LG Energy Solution likely provides
LG Energy Solution's public product materials describe passenger electric vehicle battery products and cylindrical battery formats including 2170 and 1865 cells.
That context makes battery cells or related passenger EV battery systems the most plausible product category behind the mapped relationship. The Altsets relationship itself does not identify the exact product, chemistry, factory, vehicle program, contract, or purchasing entity.
The product context and the relationship metrics answer different parts of the research question. Public product information helps explain what LG Energy Solution sells. Altsets data quantifies how economically important the mapped customer relationship appears.
Three practical uses for this relationship
The first use is customer read-through. When Tesla changes production plans, vehicle demand expectations, or purchasing behavior, the supplier revenue estimate provides a way to decide whether LG Energy Solution deserves closer attention.
The second use is customer concentration research. The 19.03% estimate can be compared with LG Energy Solution's other mapped customer relationships to determine whether Tesla is unusually important within the supplier's network. That broader ranking requires additional relationship data and is outside the scope of this page.
The third use is supplier event triage. If the research starts with LG Energy Solution instead, the 3.41% Tesla cost estimate helps place Tesla on the customer-side research list. A complete disruption study would still need substitute suppliers, inventory, qualification requirements, production locations, and other operational evidence. These are examples of the broader supply-chain data use cases, but this article stays limited to one relationship and one question about economic concentration.
What the data does not establish
The estimates do not prove that Tesla is contractually locked into LG Energy Solution or that LG Energy Solution cannot replace Tesla revenue with other customers. They also do not establish:
- exact battery volumes;
- contract duration or pricing terms;
- product exclusivity;
- inventory coverage;
- supplier substitution time;
- manufacturing capacity available to either company;
- the financial effect of a future Tesla or LG Energy Solution event.
The three relationship values are estimated research outputs, not audited invoices or contractual disclosures. For definitions of supplier revenue percentage, customer cost percentage, relationship size, and point-in-time treatment, read the Altsets supply-chain data methodology.
A different use of the same metrics
The same three metrics can answer a very different question when one supplier serves two large customers. The SK Hynix comparison of Nvidia and Apple uses relationship data to rank the relative importance of two customer relationships instead of measuring asymmetry within one relationship.
That distinction is intentional. This page asks which side of one Tesla relationship is more concentrated. The SK Hynix article asks which of two customer relationships is economically larger. Browse the Company Dependency Research collection for the rest of the company-specific research library.